
Manhattan is tilting toward sellers faster than it has in a year and a half. In June, rising demand met shrinking supply: contract activity jumped, the number of homes for sale fell, and the Volatility Index, the clearest single read on the balance between buyers and sellers, dropped to its lowest level in 18 months. Brooklyn is running hot too, but on a different track, with prices and sales climbing even as more inventory reaches the market. Neither borough points to a slowdown. Both point to a market that is active, and highly segmented.
Manhattan: demand rising into a thinning supply
Pricing held steady. Median price per square foot was $1,426 in June, essentially flat from May and unchanged from a year ago. Manhattan pricing has been remarkably stable for the last twelve months.
The real story was activity. Properties in contract rose to 4,136, up about 16% from May and roughly 24% year over year. Inventory moved the other way: 6,597 homes were for sale at the end of June, down about 3% from May and 7% from last year. Homes sold faster too, with median days on market falling from 77 in May to 68 in June.
The clearest measure of the shift is the Volatility Index, which compares the number of homes for sale with the number in contract. It fell to 1.60 in June, the lowest in 36 months, down from roughly 2.17 in April and 1.84 in May. Put plainly: there are now about 1.6 listings for every home in contract, versus 1.84 a month ago. A reading above 1 still signals a buyer's market, but the balance is swinging toward sellers as demand rises and supply contracts.
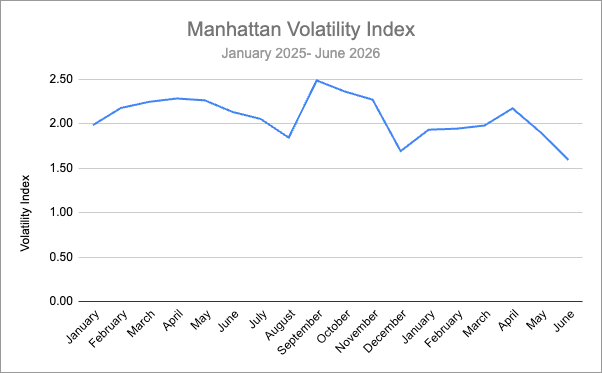
What it means: For sellers, this is the most favorable setup in over a year with less competition, faster sales, firm pricing. For buyers, the window of easy leverage is narrowing, and waiting is starting to carry a cost.
Brooklyn: climbing, but with room to choose
Brooklyn rose on nearly every front. Median price per square foot reached $1,082 in June, up about 3% from May and nearly 7% year over year. Homes in contract climbed to 2,240, up roughly 12% month over month.
The difference from Manhattan is supply. Brooklyn ended June with 3,795 homes for sale — up about 1% from May and 7% year over year — so buyers have more to choose from than a year ago, even as homes sell faster (median days on market fell from 65 to 56).
What it means: Brooklyn buyers get rising prices and quicker sales, but also more options. A genuinely different equation from Manhattan, where strengthening demand is chasing a shrinking pool of listings.
Media Narrative vs. Market Reality
Real Estate headlines are dramatic. The underlying data keeps telling a more complicated story.
Narrative: Manhattan homeowners are losing money when they sell. Source: New York Post — "Manhattan homeowners lose a median $24K upon resale"
Reality: There is truth here, but for a specific segment. An analysis of nearly 15,000 transactions found that Manhattan sellers in 2025 had a median loss of $24,000 after taxes and fees. Brooklyn sellers, by contrast, had a median gain of $159,000. The Manhattan losses were concentrated among certain property types and purchase periods, particularly condos bought during the luxury boom of the mid-2010s. Those resale losses are real, and any particular seller may still find that their property is worth less than when they bought it. But that does not describe the current market overall, where June data shows stable pricing and rising activity.
Narrative: Mortgage rates are suppressing housing market activity. Source: Reuters — "High mortgage rates keep the housing market subdued"
Reality: Nationally, that holds. Rates near 6.6% have kept turnover close to historic lows, and a June survey of specialists expects the 30-year rate to stay above 6% through 2028. But New York is not moving in lockstep with the national market. Despite the same rates, Manhattan contracts were up about 24% year over year in June, and Brooklyn a bit over 3%. Rates certainly affect affordability; the June data simply doesn't show demand being broadly suppressed here.
Narrative: The new pied-à-terre tax will drive luxury buyers out of Manhattan. Source: The Wall Street Journal — "The pied-à-terre tax comes for Billionaires' Row"
Reality: At 432 Park Avenue, reporting suggests more than a third of the building's 92 residences could be affected, with some tax bills potentially doubling. It's a real cost, and one worth watching. But we are not seeing a retreat: June brought 139 contracts above $4 million and 29 above $10 million, with $4M+ deals at 12.5% of the total. The standout was an $80 million penthouse contract at 80 Clarkson in Hudson Square, a downtown development that has reportedly crossed $1 billion in total contracts since launching sales. That depth at the very top signals real demand.
Pied-à-Terre Tax Update
A reminder for owners who may be affected: New York City's new fiscal year began July 1, which is also when the new pied-à-terre surcharge took effect.
The NYC Department of Finance has until August 30, 2026 to notify owners it has identified as potentially subject to the tax. Owners then have a limited window to challenge that determination, so if you receive a notice, review it promptly with your legal and tax advisers.
Every building and block in this market moves at its own pace and the borough-level numbers only tell part of the story. If you're weighing a move, curious what your home would fetch today, or trying to work out whether the pied-à-terre tax affects you, reach out to us. We are here to help.
Best Wishes,
Boris Fabrikant, Esq and Collin Bond, Esq.